In our previous Python tutorial, we have explained how to do Web Scraping using Python. In this tutorial, we will explain how to Monitor Memory Consumption in Python.
Due to simplicity and robustness, Python is popular among data science community. The Data Scientists use Python to process huge amount of data and often prone to memory management issues. If code execution exceeds the memory limit, memory errors returns and execution terminates.
To overcome the memory issue, one may increase the memory allocation. But it’s not always feasible. Often coders do not release unused memmory and continuously assign new variables, that may increase memory consumption. When the code executed, more memory consumed. Python automatically manages memory consumption but it fails to return the memory consumption while executing long programs.
So there tools needed to monitor the memory consumtion to optimize the memory. Here in this tutorial, we will use Memory Profiler module from Python to monitor the memory consumption of the Python proram. The Memory Profiler uses psutil module internally to monitor line-by-line memory consumptions of Python program.
Install Modules
The Memory Profiler module can be installed using below command.
pip install -U memory_profiler
Memory Profiler Usage
After installing Memory Profiler module, we can easily use this module to track the memory consumption of the program.
First we will import the Memory Profiler module.
from memory_profiler import profile
The @profile decorator will be used before every function to be tracked. It will track the memory consumption line-by-line in the same way as of line-profiler.
Now we will @profile decorator with function in our Python script to track it.
from memory_profiler import profile

@profile
def calculate():
    num1 = 50
    num2 = 30
    sum =  num1 + num2
    return sum

if __name__=='__main__':
  calculate()
The above Python script will be run bypassing -m memory profiler when run script. It will track the memory consumption line-by-line and print it.
We will run the script like below:
python -m memory_profiler <filename>.py
The following line-by-line memory consumption report printed after script execution.
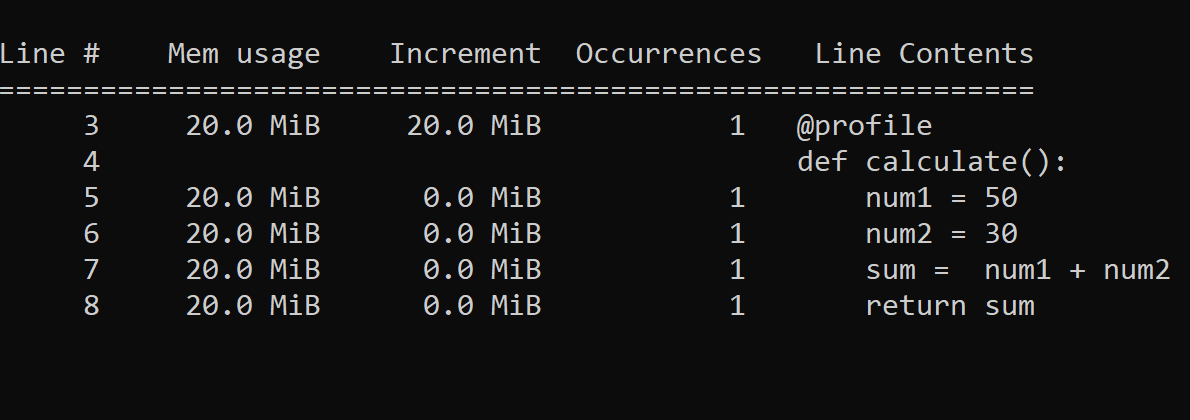
The above report displays following:
- Line #: Print Line Number
- Line Contents: Print code from each line number
- Mem usage: Print memory usage by the Python interpreter after execution of each line.
- Increment: Sum of memory consumption after execution of each line.
- Occurrences: Print number of times a particular line of code is executed.
You can further read the documentation of the memory profiler module for better usage.